This is a quick little post where I make sure that I can still update this blog, and that I’m not missing any packages.
library (tidyverse)library (xml2)<- read_xml ('energy_usage.xml' )<- readLines ('energy_usage.xml' , n = 100 )cat (xml_preview, sep = ' \n ' )
<?xml version="1.0" encoding="UTF-8" standalone="yes"?>
<ns3:entry xmlns:espi="http://naesb.org/espi" xmlns:ns3="http://www.w3.org/2005/Atom">
    <ns3:link href="https://prod.apigee.duke-energy.app/meter-usage/v1/usage" rel="self"/>
    <ns3:content>
        <ns3:id>urn:uuid:9de9a99e-cd41-5ff6-91ad-5725d03da0af</ns3:id>
        <espi:IntervalBlock>
            <espi:interval>
                <espi:servicePointId>6007045176</espi:servicePointId>
                <espi:Meter>
                    <espi:meterSerialNumber>108284252</espi:meterSerialNumber>
                    <espi:meterInstallDate>2016-08-16T00:00</espi:meterInstallDate>
                    <espi:meterTerminationDate></espi:meterTerminationDate>
                </espi:Meter>
                <espi:serviceType>ELECTRIC</espi:serviceType>
                <espi:unitOfMeasure>kWH</espi:unitOfMeasure>
                <espi:secondsPerInterval>900</espi:secondsPerInterval>
                <espi:duration>65746800</espi:duration>
                <espi:start>1733893200</espi:start>
            </espi:interval>
            <espi:IntervalReading>
                <espi:timePeriod>
                    <espi:start>1733893200</espi:start>
                </espi:timePeriod>
                <espi:readingQuality>ACTUAL</espi:readingQuality>
                <espi:value>0.04</espi:value>
            </espi:IntervalReading>
            <espi:IntervalReading>
                <espi:timePeriod>
                    <espi:start>1733894100</espi:start>
                </espi:timePeriod>
                <espi:readingQuality>ACTUAL</espi:readingQuality>
                <espi:value>0.02</espi:value>
            </espi:IntervalReading>
            <espi:IntervalReading>
                <espi:timePeriod>
                    <espi:start>1733895000</espi:start>
                </espi:timePeriod>
                <espi:readingQuality>ACTUAL</espi:readingQuality>
                <espi:value>0.01</espi:value>
            </espi:IntervalReading>
            <espi:IntervalReading>
                <espi:timePeriod>
                    <espi:start>1733895900</espi:start>
                </espi:timePeriod>
                <espi:readingQuality>ACTUAL</espi:readingQuality>
                <espi:value>0.02</espi:value>
            </espi:IntervalReading>
            <espi:IntervalReading>
                <espi:timePeriod>
                    <espi:start>1733896800</espi:start>
                </espi:timePeriod>
                <espi:readingQuality>ACTUAL</espi:readingQuality>
                <espi:value>0.01</espi:value>
            </espi:IntervalReading>
            <espi:IntervalReading>
                <espi:timePeriod>
                    <espi:start>1733897700</espi:start>
                </espi:timePeriod>
                <espi:readingQuality>ACTUAL</espi:readingQuality>
                <espi:value>0.02</espi:value>
            </espi:IntervalReading>
            <espi:IntervalReading>
                <espi:timePeriod>
                    <espi:start>1733898600</espi:start>
                </espi:timePeriod>
                <espi:readingQuality>ACTUAL</espi:readingQuality>
                <espi:value>0.01</espi:value>
            </espi:IntervalReading>
            <espi:IntervalReading>
                <espi:timePeriod>
                    <espi:start>1733899500</espi:start>
                </espi:timePeriod>
                <espi:readingQuality>ACTUAL</espi:readingQuality>
                <espi:value>0.02</espi:value>
            </espi:IntervalReading>
            <espi:IntervalReading>
                <espi:timePeriod>
                    <espi:start>1733900400</espi:start>
                </espi:timePeriod>
                <espi:readingQuality>ACTUAL</espi:readingQuality>
                <espi:value>0.02</espi:value>
            </espi:IntervalReading>
            <espi:IntervalReading>
                <espi:timePeriod>
                    <espi:start>1733901300</espi:start>
                </espi:timePeriod>
                <espi:readingQuality>ACTUAL</espi:readingQuality>
                <espi:value>0.01</espi:value>
            </espi:IntervalReading>
            <espi:IntervalReading>
                <espi:timePeriod>
                    <espi:start>1733902200</espi:start>
                </espi:timePeriod>
                <espi:readingQuality>ACTUAL</espi:readingQuality>
                <espi:value>0.02</espi:value>
            </espi:IntervalReading>
            <espi:IntervalReading>
                <espi:timePeriod>
                    <espi:start>1733903100</espi:start>
                </espi:timePeriod>
Okay now that I have a little sample of how the file is laid out I can try to read in the whole file, despite it being quite big, but I’m on the clock so who cares.
<- read_xml ('energy_usage.xml' )<- xml_ns (doc)# Metadata from the interval block <- xml_find_first (doc, ".//espi:interval" , ns)<- tibble (service_point_id = xml_text (xml_find_first (interval, ".//espi:servicePointId" , ns)),meter_serial_number = xml_text (xml_find_first (interval, ".//espi:meterSerialNumber" , ns)),meter_install_date = xml_text (xml_find_first (interval, ".//espi:meterInstallDate" , ns)),service_type = xml_text (xml_find_first (interval, ".//espi:serviceType" , ns)),unit_of_measure = xml_text (xml_find_first (interval, ".//espi:unitOfMeasure" , ns)),seconds_per_interval = as.integer (xml_text (xml_find_first (interval, ".//espi:secondsPerInterval" , ns))),interval_start_unix = as.numeric (xml_text (xml_find_first (interval, ".//espi:start" , ns)))# Repeated meter readings <- xml_find_all (doc, ".//espi:IntervalReading" , ns)<- map_dfr (readings, \(x) {tibble (reading_start_unix = as.numeric (xml_text (xml_find_first (x, ".//espi:timePeriod/espi:start" , ns))),reading_quality = xml_text (xml_find_first (x, ".//espi:readingQuality" , ns)),value = as.numeric (xml_text (xml_find_first (x, ".//espi:value" , ns)))|> mutate (reading_datetime = as_datetime (reading_start_unix)<- bind_cols (rep (1 , nrow (usage_data)), ]
reading_start_unix is the unix UTC date and time.
reading_quality is a junk value, this column will be dropped.
value is kilowatt used in that 15 minute interval.
reading_datetime is the date and time the 15 minute interval reading starts.
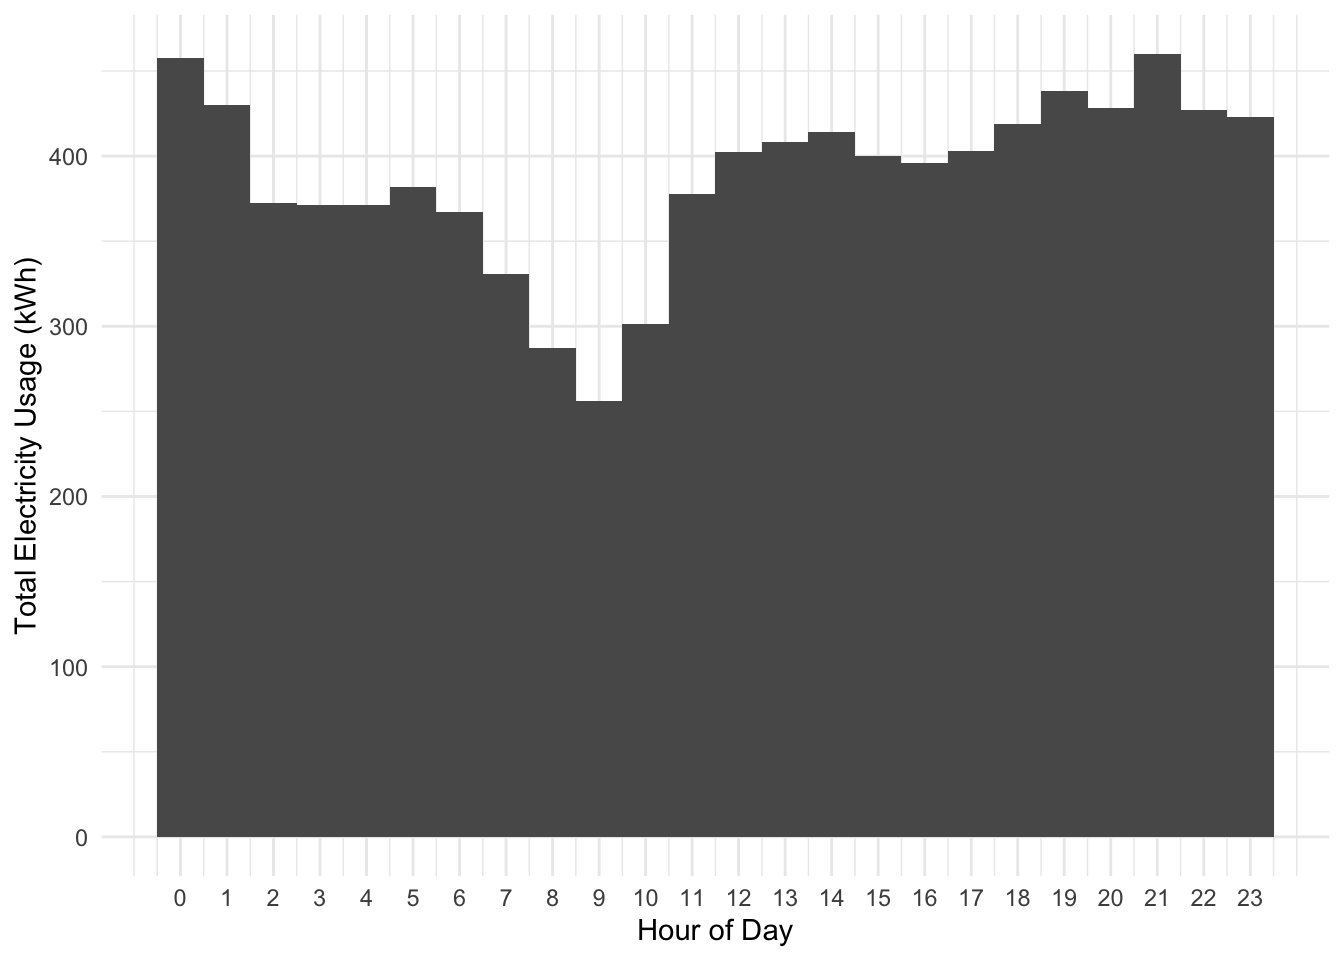
Something that immediately pops into my head, is a simple histogram of the data to see what times of day I use the most electricity. I am going to convert the data to being in my timezone, and drop the junk column.
<- usage_data |> mutate (reading_time = with_tz (reading_start_unix, "America/New_York" )) |> select (reading_time, value)
Now I am going to make a histogram of usage by hour.
<- usage_data_adjusted |> mutate (hour = hour (reading_time))ggplot (usage_hourly, aes (x = hour, weight = value)) + geom_histogram (binwidth = 1 ) + scale_x_continuous (breaks = 0 : 23 ) + labs (x = "Hour of Day" ,y = "Total Electricity Usage (kWh)" + theme_minimal ()
Well this isn’t that interesting since it seems like my usage is fairly spread out throughout the day, with usage dipping from 06:00 to 12:00 which is interesting because I generally wake up around 08:00 and start work at 10:00.