library(tidyverse)
library(googlesheets4)
library(janitor)I used to weigh around 270 lbs and realized that I needed to make some changes to my lifestyle. I started to track calories and managed to get my weight down to 250. I got a walking pad and started to try to be more consistent about walking daily while I was working. After hitting this initial goal, I was able to get on Zepbound and I started to take Zepbound August 31st 2025. What follows is roughly a year of data of tracking my steps and weight.
There are a few steps here that will be skipped due to privacy, but I log my steps into a Google sheet. I use Apple Health to track my steps and it seems to do a good job of deduplicating steps when my fitness band syncs with my phone.
Now to load in the data, this step will be redacted, but there are plenty of places you can find people using googlesheets4 to download data from a sheet.
I joined the 2025 and 2026 data into one dataset so I can plot the full year of data that I have tracking my steps and weight. I’ll include a little glimpse of what the data looks like.
df_raw_sheet_data <- read_tsv("step_data.txt")

glimpse(df_raw_sheet_data)
Rows: 549
Columns: 7
$ date <dttm> 2025-07-01, 2025-07-02, 2025-07-03, 2025-07-04, 20…
$ day <chr> "Tuesday", "Wednesday", "Thursday", "Friday", "Satu…
$ steps <dbl> 6448, 9143, 4937, 6680, 8057, 6109, 10405, 12040, 8…
$ weekly_total_steps <chr> NA, NA, NA, NA, NA, "Steps Taken: 41,374 Remaining:…
$ weight <dbl> NA, NA, NA, NA, NA, NA, NA, NA, 248.0, NA, NA, NA, …
$ blood_pressure <chr> NA, NA, NA, NA, NA, NA, NA, NA, NA, NA, NA, NA, NA,…
$ notes <chr> NA, NA, NA, NA, NA, NA, NA, NA, NA, NA, NA, NA, NA,…Now to make some simple plots since there isn’t much in this data.
df_raw_sheet_data |>
    select(date, day, steps) |>
    ggplot(aes(x = date, y = steps)) +
    geom_line()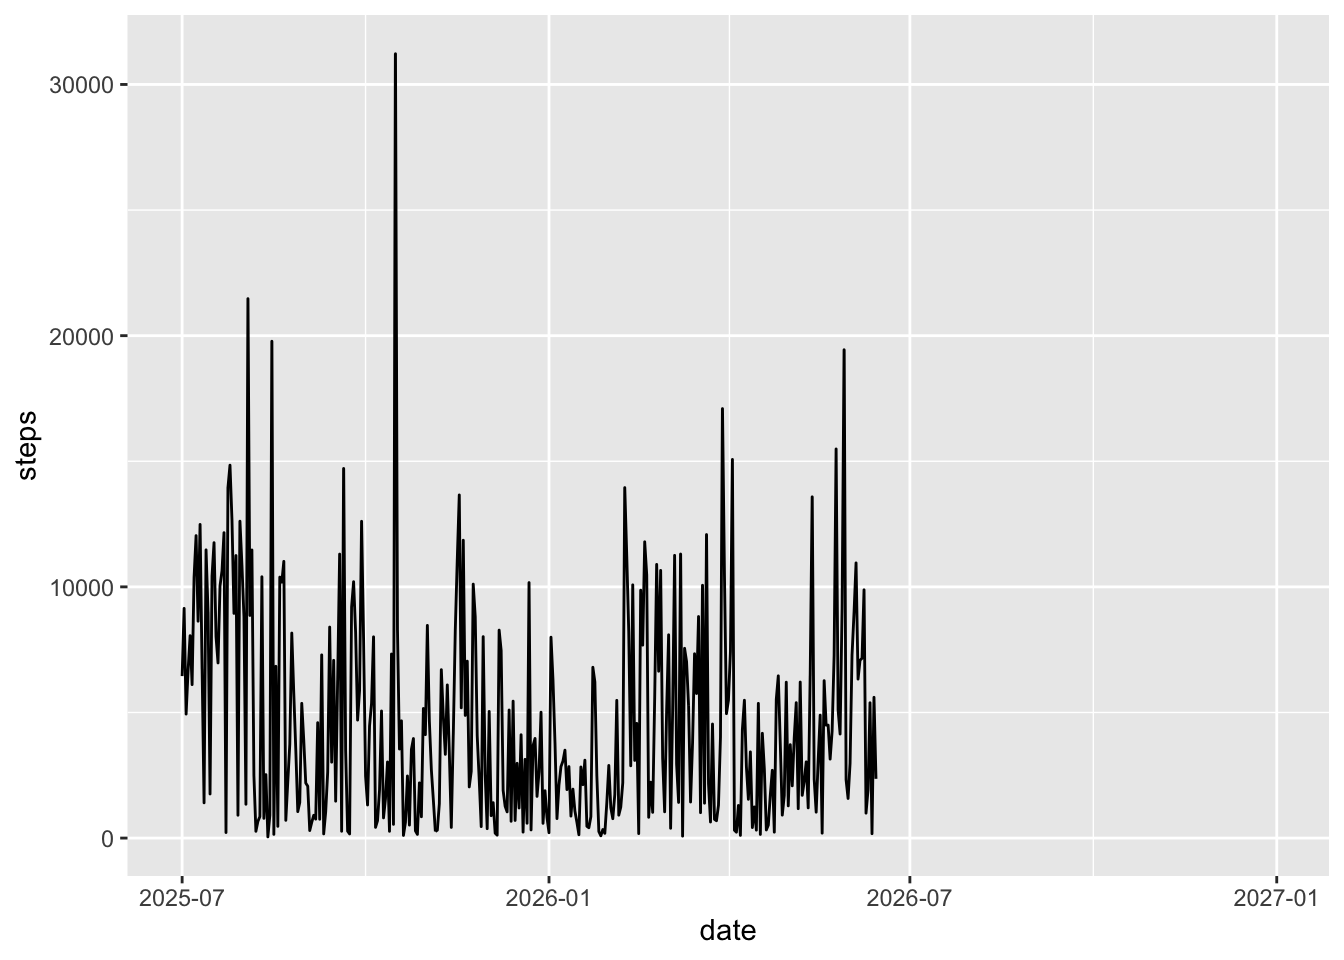
The sheet is pre-made for a full year, so I need to remove the rows that have no entries.
df_raw_sheet_data |>
    select(date, day, steps) |>
    filter(!is.na(steps)) |>
    ggplot(aes(x = date, y = steps)) +
    geom_point()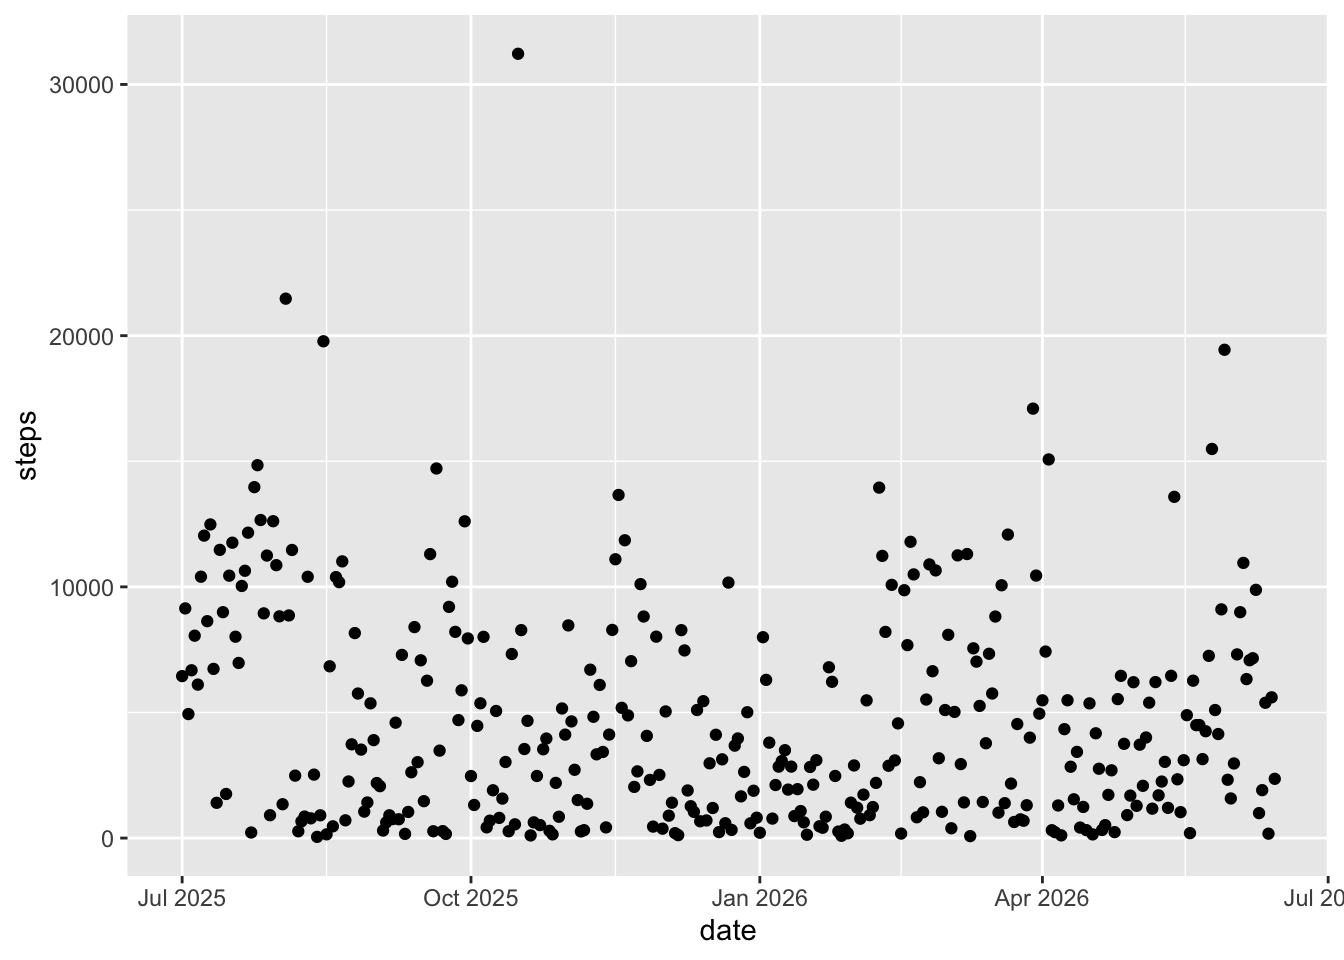
Giving this a quick glance, it looks like the number of days I walk less than 1,000 steps is vastly larger than the days where I walk over 10,000. I need to have my phone in my pocket for steps to be tracked, and I’ve tried various ways to get around this, but none of them have worked consistently. Fitness bands don’t correctly track steps when I am on a treadmill while working. The other problem is just laziness. I work from home and some days I don’t do much else besides work, cook, and dink around. When I am just doing nothing I leave my phone on my desk so it’s not capturing all my steps, but there really is no excuse for getting so few steps.
df_raw_sheet_data |>
    select(date, day, steps) |>
    filter(!is.na(steps)) |>
    ggplot(aes(x = steps)) +
    geom_histogram(binwidth = 1000)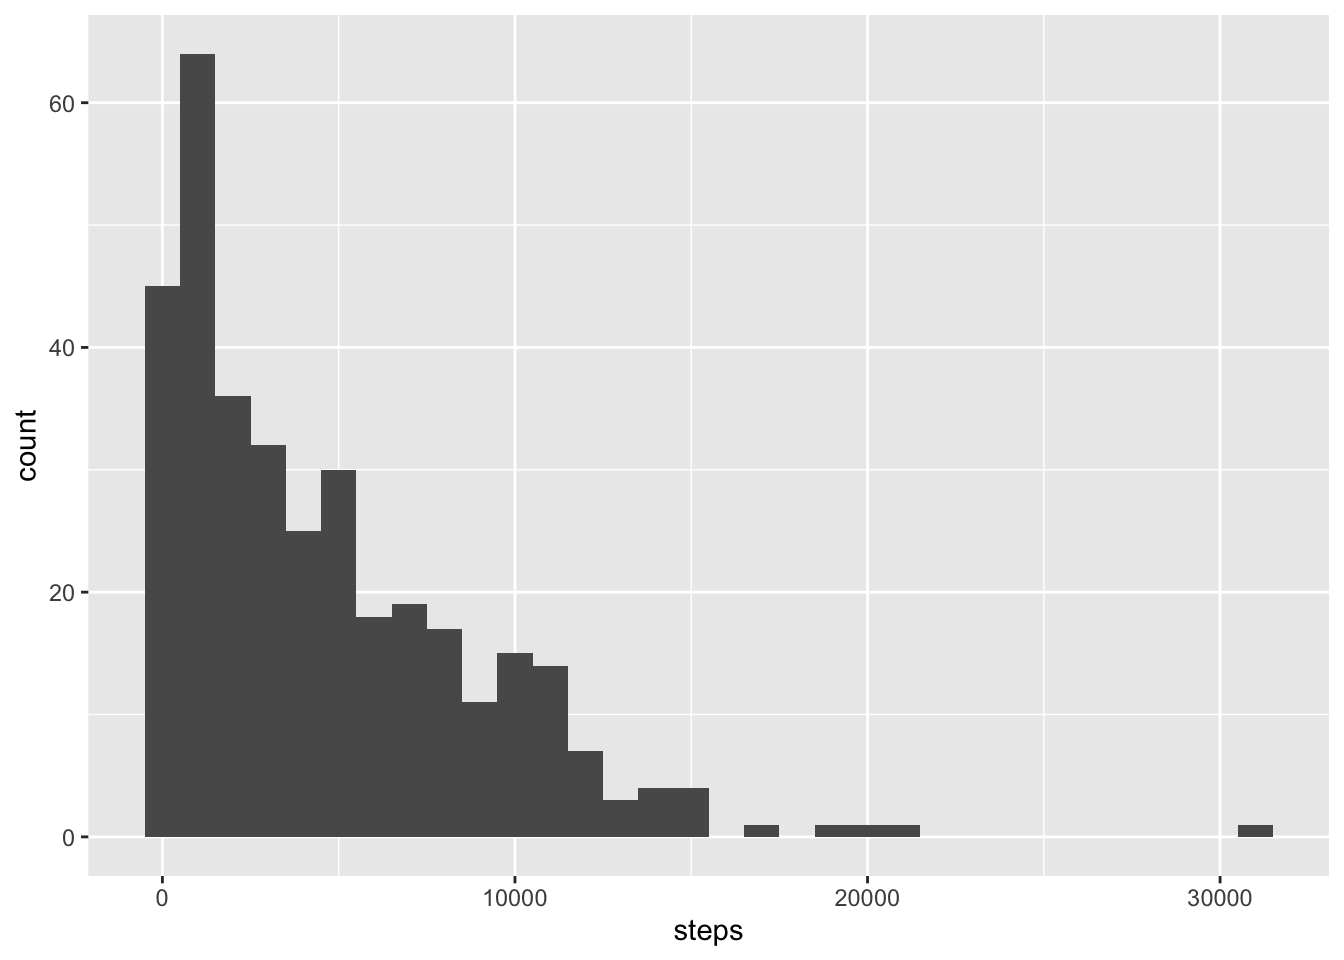
Disappointing to see that I’ve walked less than I thought I had. I figured I had more days around 6k steps than under, but this is why I track the data, and a good reminded to review the data I track.
Let’s look at my weight over time.
df_raw_sheet_data |>
    select(date, day, steps, weight) |>
    filter(!is.na(steps)) |>
    ggplot(aes(x = date, y = weight)) +
    geom_point()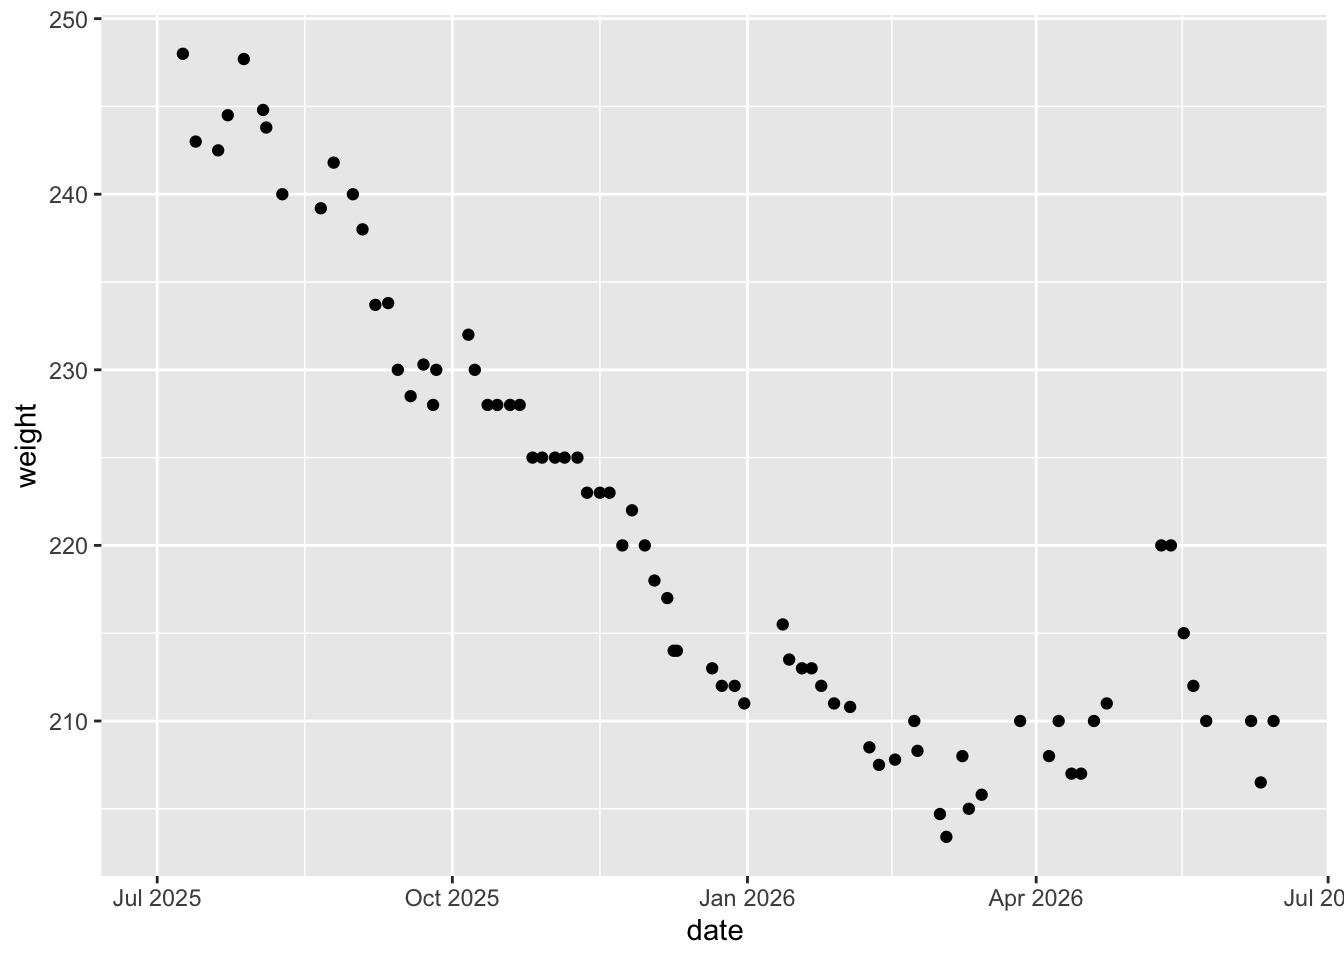
Really both sets of data should be simplified down to a weekly average since that’s probably the best way to view this data.
df_weekly_summary <- df_raw_sheet_data |>
    filter(!is.na(steps)) |>
    mutate(week_start = floor_date(date, unit = "week", week_start = 1)) |>
    group_by(week_start) |>
    summarise(
        avg_steps = mean(steps, na.rm = T),
        avg_weight = mean(weight, na.rm = T),
        .groups = "drop")

ggplot(df_weekly_summary, aes(x = week_start, y = avg_steps)) +
    geom_line(linewidth = 1) +
    geom_point(size = 2) +
    scale_y_continuous(labels = scales::comma) +
    labs(
        x = NULL,
        y = "Average Daily Steps",
        title = "Weekly Average Steps"
    ) +
    theme_minimal(base_size = 14)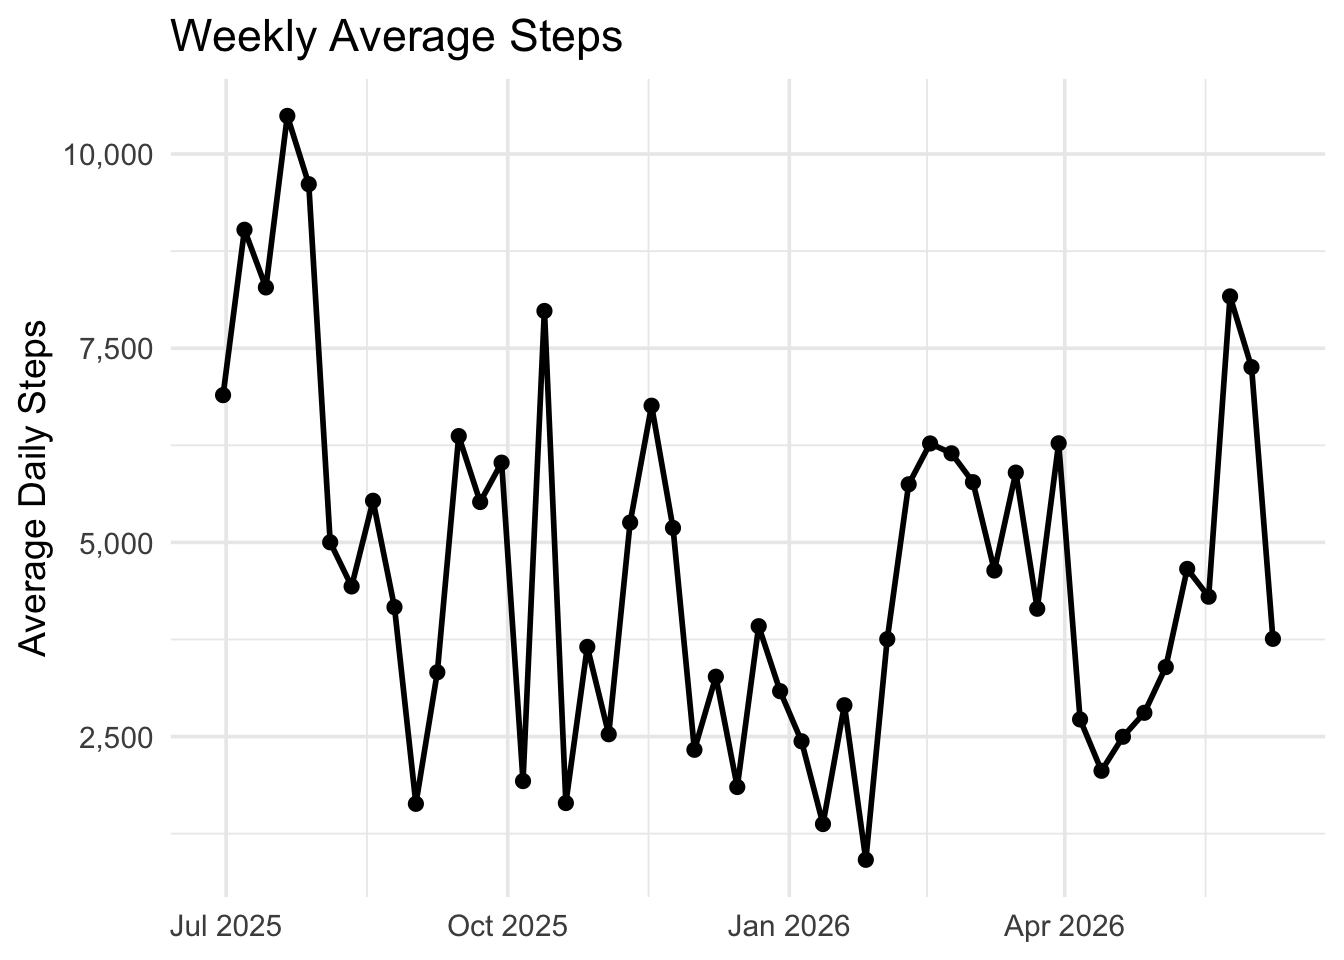
ggplot(df_weekly_summary, aes(x = week_start, y = avg_weight)) +
    geom_line(linewidth = 1) +
    geom_point(size = 2) +
    labs(
        x = NULL,
        y = "Average Weight (lb)",
        title = "Weekly Average Weight"
    ) +
    theme_minimal(base_size = 14)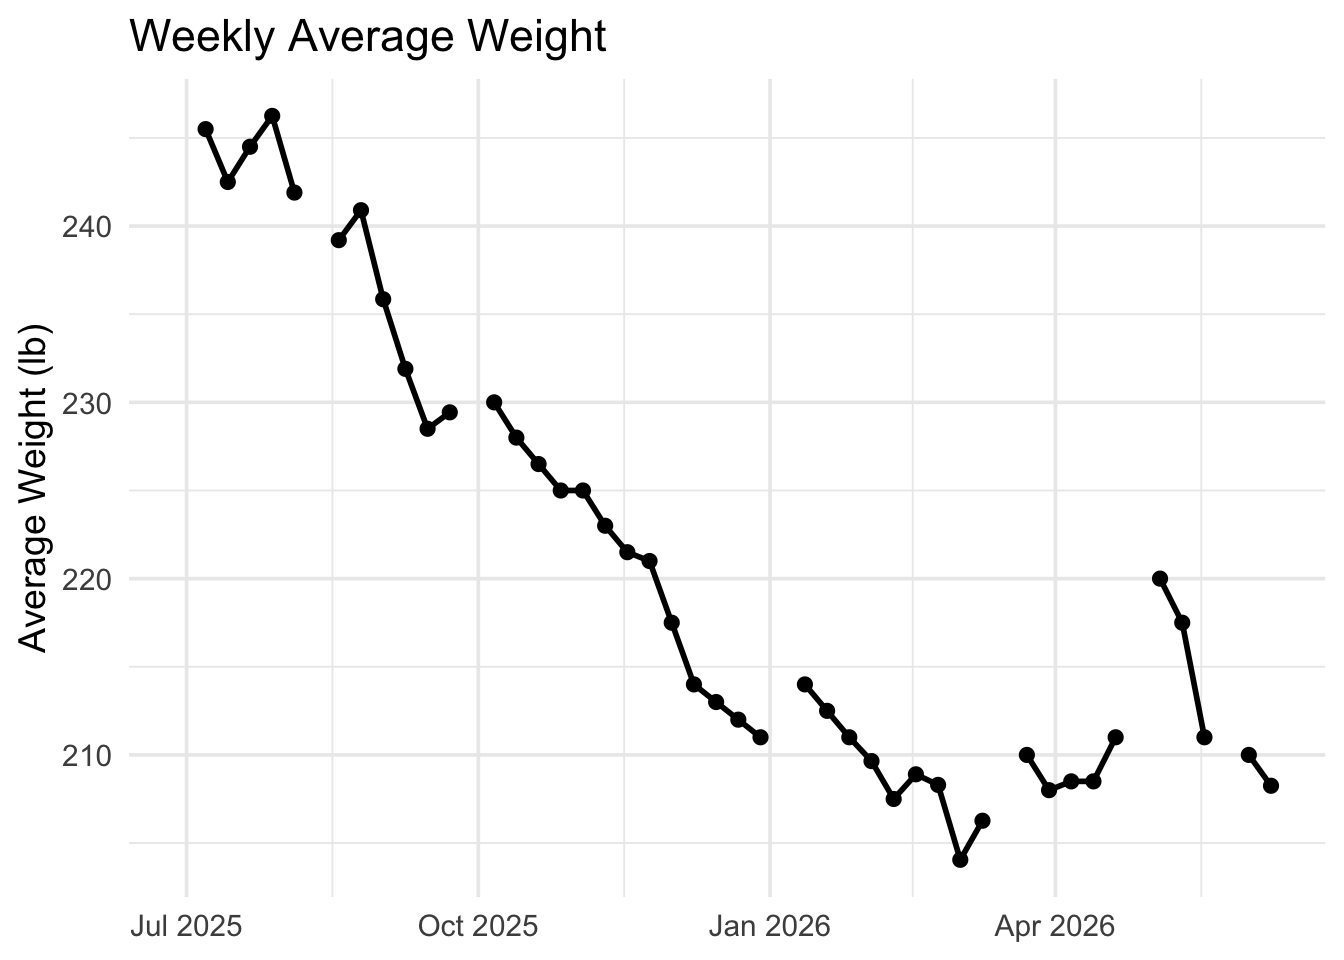
I know that some of the stall in weight loss has been due to me strength training, and losing weight is hard when strength training. I am losing fat, and I can see more muscle definition, but overall I am not losing weight on the scale. Looks like it’s time to get back on the calorie tracking train.